The first round of data from the 2016 Census was released last month.
Although it’s nearly one year old, the data will be used to form government policy, planning and service delivery over the coming years.
But it also provides some useful insights for property investors. Here are some of the most noteworthy:
Growth areas
Since population growth is a key driver of property prices, investors want to buy in growth areas. So it’s useful to look at which areas the 2016 Census identified as the fastest growing.
Australia’s population is growing strongly overall, rising from 21.5 million in 2011 to 23.4 million in 2016, or 8.8%.
Sydney is the most highly populated area, being home to 4.8 million people. More than 1600 people have moved to Sydney every week since 2011, with the result that it has grown by 9.8%.
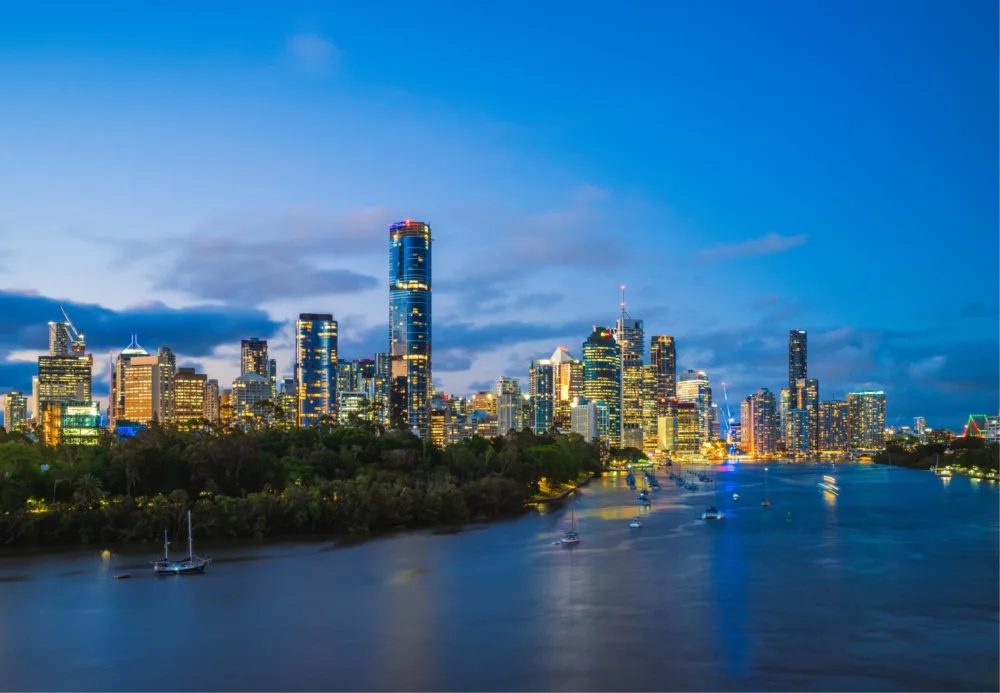
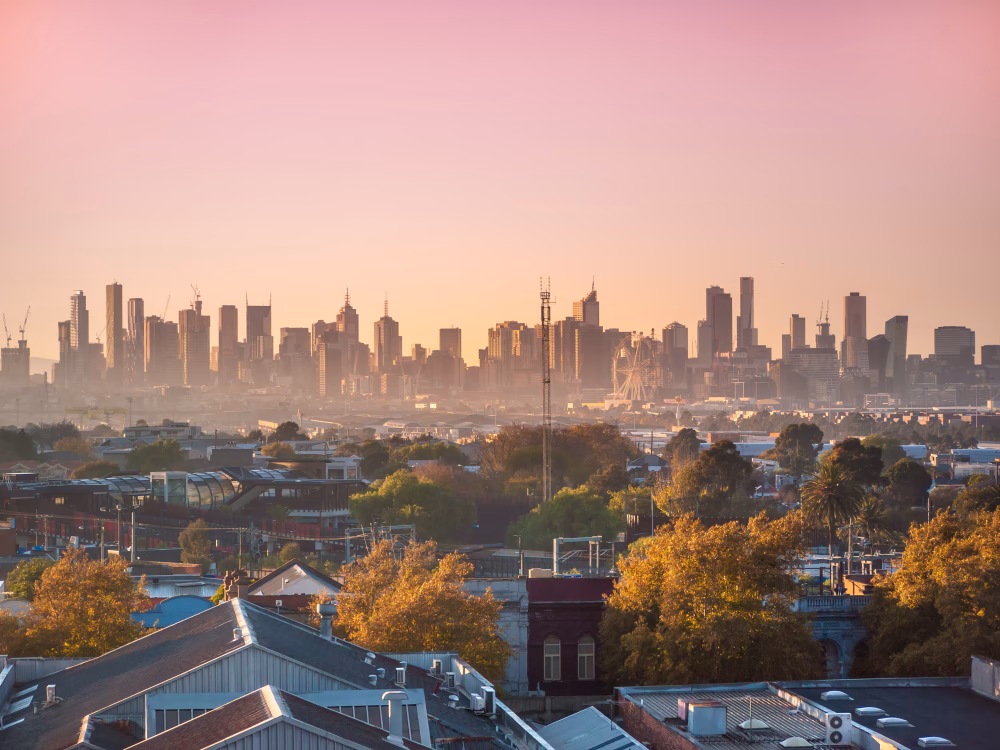
But Melbourne, which currently has 4.4 million residents, is on track to overtake Sydney to become the most highly populated city by 2050.
Melbourne has grown by 12% since 2011, adding just under 2000 new residents each week, and Melbourne City was the third-fastest growing region in Australia with a population increase of 45%, according to the Census.
The fastest-growing region in Australia was the Shire of Serpentine-Jarrahdale, in Perth’s outer southeast. The area has grown by a huge 50%.
The Australian Capital Territory had the largest population growth of any state or territory from 2011 to 2016, adding more than 40,000 new residents.
There was more growth in capital cities than regional areas, according to Census data.
Two-thirds of the population live in Australia’s capital cities, with the number of people living in capitals growing by 10.5% between the 2011 and 2016 Census, nearly double the 5.7% growth rate for areas outside capital cities.
Of course, there are plenty of growth areas within each state and territory around Australia, and if you purchased in any of these six years ago, you would likely have seen significant growth in your investments, if you selected well.
While it’s helpful to look at the growth figures from the Census, investors must be wary of the lag in the data. You should bear in mind that much of this data is looking at past growth, and investors will need to look at which areas will grow in the future.
More people are renting
The Census confirmed what we’ve known for a while – that home ownership is declining and more people are renting.
While home ownership figures might not be ideal for those aspiring to the Great Australian Dream, it’s welcome news to investors, as the tenant pool is increasing.
In 1991, 41.1% of homes were owned outright in Australia, but in 2016 the figure had declined to 31%.
But people are still buying homes, with more homes owned with a mortgage – in 1991 this figure was 27.5% but in 2016 it’s risen to 34.5%.
While affordability is considered to be a big issue in Australia, the 2016 Census actually found monthly mortgage repayments have fallen from $1800 to $1755.
Hobart has the lowest housing costs, with a median monthly mortgage repayment of $1402 and a median weekly rent of $260.
Darwin and Sydney have the highest monthly mortgage repayments of $2200 a week.
Meanwhile, mortgage repayments that are less than 30% of a household’s income – the bar for housing stress – have increased from 90.1% to 92.8% from 2011 to 2016.
The weekly median income of Australians has grown from $577 in 2011 to $662 in 2016, but household budgets are tighter, with living expenses and stagnant wage growth causing headaches.
One reason for tighter budgets is growing rents, with weekly median rents up from $285 to $335.
Sydney rents are the most expensive in Australia, with the median weekly rent being $440, and 22% of households are spending more than 30% of their income on rent.
The percentage of households renting their home has risen from 26.9% in 1991 to 30.9 in 2016.
Darwin has the largest number of renters, with more than 44% of residents renting, and this capital also recorded Australia’s highest median weekly income at $1052.
Greater Adelaide was found to have Australia’s lowest median weekly personal income of $617.
Sydney and Brisbane also have a fairly high number of renters, with more than 34%.
Will housing and infrastructure keep up with demand?
As our population continues to grow governments will need to ensure there is enough housing and infrastructure to cater for it.
Households are getting smaller, which we already knew, with 24.4% occupied by just one person, up from 20% in 1991, and this means we likely need more housing, and more smaller housing, such as apartments. An increasing number of households have no children and our population is also ageing and downsizing, with the median age rising slightly from 37 to 38 over the past decade and those aged over 65 making up 16% of the population, up 2% from five years prior.
Houses are becoming a less popular property type, now making up 73% of dwellings, down from 76% in 2011. The remaining 27% is made up of semi or terrace houses or townhouses, and flats.
The importance of investing
As our population ages and home ownership declines, it’s clear that investing in property is more important than ever.
Our government is going to have fewer taxpayers but will need more money to dish out to an ageing population reliant on a pension, with lots of question marks over how they will provide for this.
So if you’re looking to invest but aren’t quite sure how to get started The Edge Property Buyers are here to help, book a free 30-minute consultation with us today!